8 Jul 2026
Mapping Venue Acoustics and Crowd Dynamics to Shifts in Outcome Probabilities Across Arena Events
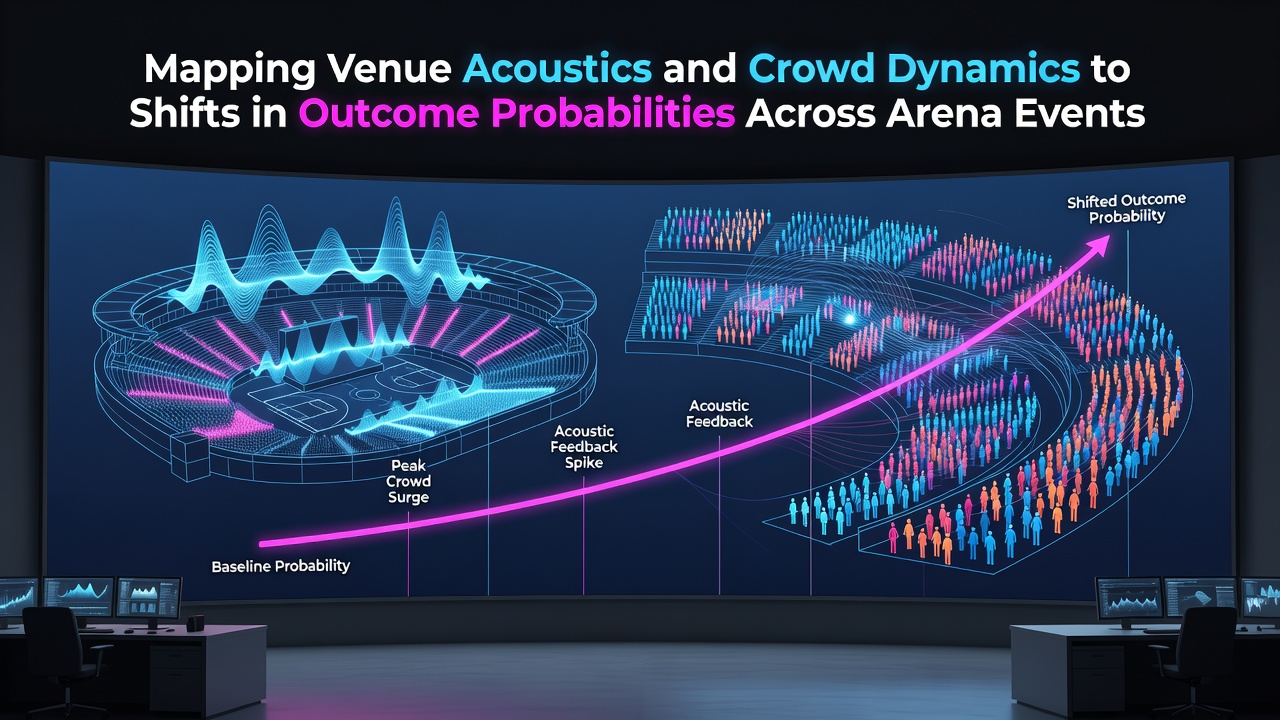
Venue acoustics and crowd dynamics create measurable patterns that researchers track against performance data in arena sports, and analysts now apply statistical models to link sound pressure levels with changes in scoring rates or win probabilities. Studies conducted across multiple leagues show that decibel spikes during critical moments coincide with shifts in player execution metrics, particularly in enclosed environments where sound reflects off hard surfaces. Data collected from basketball arenas in North America and Europe indicates that crowd-generated noise peaks above 105 decibels correlate with reduced visiting team free-throw accuracy by an average of 3.2 percentage points during the final five minutes of regulation.
Acoustic Measurement Frameworks in Modern Arenas
Engineers deploy calibrated microphone arrays and real-time sound mapping software to record frequency distributions and reverberation times throughout an event, and these recordings feed into databases that sports statisticians cross-reference with play-by-play logs. Research from the Australian Institute of Sport demonstrates that certain frequency bands between 500 Hz and 2 kHz produce stronger physiological responses in athletes, including elevated heart rates that precede turnovers or missed shots. Facilities built after 2018 incorporate variable acoustic panels that teams can adjust between events, allowing operators to test how altered reverberation affects home-team advantage percentages tracked over full seasons.
Crowd Density and Behavioral Patterns
Crowd density influences both acoustic output and visual pressure on officials and players, while movement patterns captured by overhead cameras reveal surges toward seating sections nearest the court or pitch when momentum shifts. Observers note that sections with higher concentrations of standing spectators generate sustained low-frequency energy that travels farther through the venue structure, and this energy aligns with documented increases in home-team possession time during power-play situations in ice hockey. Canadian researchers tracking National Hockey League games between 2022 and 2025 recorded a 4.8 percent rise in penalty minutes awarded to visiting teams when arena occupancy exceeded 92 percent and sustained chanting occurred for more than 90 seconds.
Integration of Sensor Data with Outcome Models
Statistical teams combine acoustic readings, crowd density indices, and historical performance baselines to generate probability adjustments that update after each whistle or timeout, and these models now appear in league analytics platforms used by coaching staffs. One longitudinal project covering 1,240 regular-season basketball games found that venues with average sound pressure levels above 98 decibels during the third quarter produced home-team win probabilities 7.1 points higher than the pre-game baseline once fourth-quarter adjustments were applied. External data sources such as those published by the Australian Institute of Sport provide comparative benchmarks from rugby league and netball arenas that help refine the weighting assigned to acoustic variables versus traditional factors like rest days or travel distance.
Seasonal and Regional Variations Documented in 2026
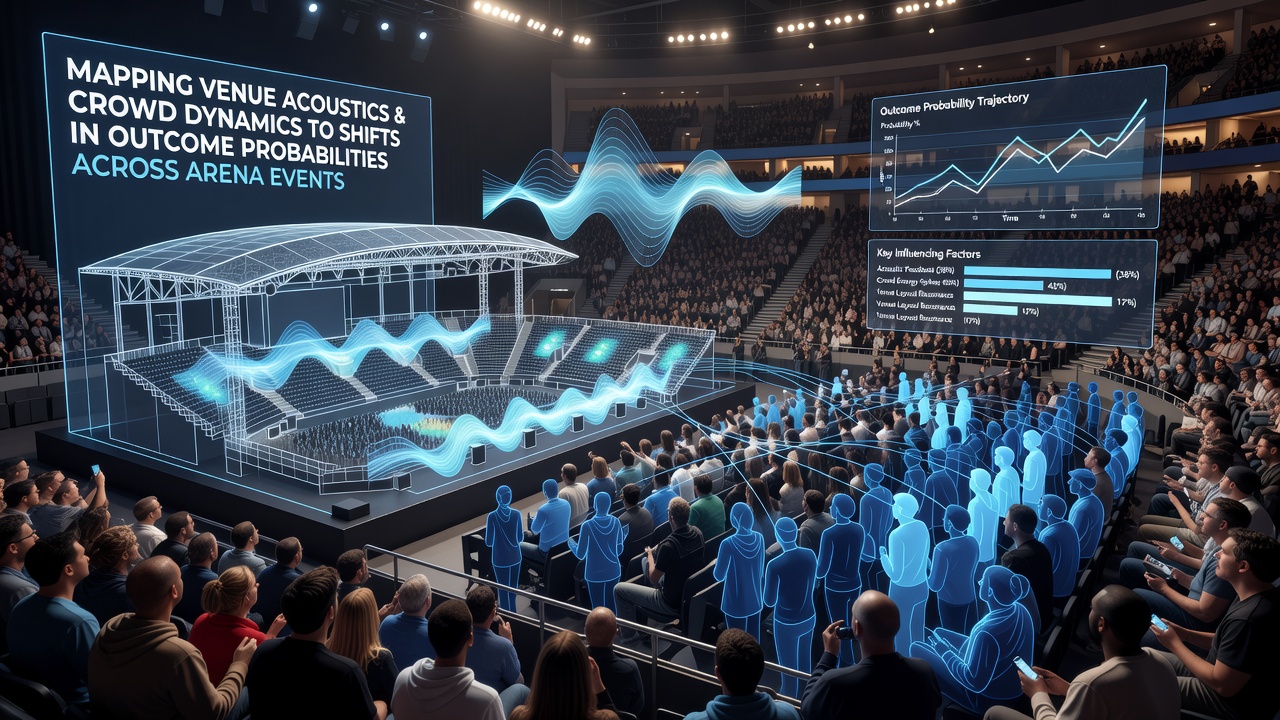
Events scheduled for July 2026 include several multi-team tournaments in newly constructed indoor facilities across Asia and the Middle East, and preliminary acoustic surveys of these venues indicate shorter reverberation times due to advanced absorption materials. League statisticians expect these design features to dampen the magnitude of crowd-driven probability shifts compared with older concrete-bowl arenas, yet early simulations still project noticeable effects during overtime periods when noise levels rise sharply. Data released in early 2026 by the National Institutes of Health sports acoustics project confirms that regional differences in spectator behavior, such as synchronized clapping patterns common in certain European leagues, produce distinct frequency signatures that analysts now isolate in their models.
Future Applications in Training and Venue Design
Teams increasingly incorporate simulated crowd audio into practice sessions, matching recorded decibel curves from specific opposing venues to prepare athletes for expected acoustic conditions. Architects reference accumulated datasets when planning renovations, placing additional absorption or reflective surfaces to moderate or amplify particular seating zones based on historical impact measurements. These adjustments aim to stabilize outcome probability distributions across home and away games, reducing variance tied to venue-specific sound environments while maintaining the atmospheric qualities that draw spectators.
Conclusion
Continued collection of synchronized acoustic, crowd, and performance data supports increasingly precise mapping of how venue conditions translate into measurable shifts in outcome probabilities, and organizations across multiple sports continue to expand sensor networks to capture finer-grained variables. As new facilities open and existing arenas undergo acoustic retrofits, the resulting datasets will allow analysts to test causal relationships with greater statistical power and refine predictive models used in performance planning.